
Use ApiCatcher Instead of the Browser’s Network Panel, Same Experience, but Those Requests the Network Panel Can’t See Are All Visible
When we debug web APIs, most of us open Chrome F12 and look at the Network panel. The panel has a few problems though. Some requests you never see. Some you see for a second, then they are gone, and you cannot get them back.
What is wrong with the Network panel
Say you want to inspect a login API, or any form submit. The page redirects as soon as the response comes back, and that request disappears from the Network panel almost immediately. You did not even get to open the response. You also cannot find it again.
Debugging a Chrome extension is similar. Requests the extension sends in the background only show up in the Inspect pop-up window. Click another browser tab and that window is gone. Open Inspect pop-up again, and the requests you just had are not there.
The Network panel also only shows requests for the current location. It does not keep history. Refresh the page while debugging and the previous requests are gone. If you want to look at them again, you have to reproduce the whole thing and fire the APIs one more time.
How ApiCatcher capture is different
ApiCatcher desktop does not watch the current browser tab. It captures through the system proxy. HTTPS requests Chrome sends, if they go through the system proxy, get captured. It does not matter whether F12 is open, whether the page redirected, or whether the extension Inspect-popup window is still around.
So after login redirects, that POST is still in the capture. Requests the extension sent in the background are captured too. You do not have to keep the inspect window open. Refresh the page, and older requests are still there. You do not have to reproduce them to look again.
The capture list is chronological by default though. Open a web page and you get documents, CSS, JS, images, and APIs all mixed together. Finding XHR for one site is annoying. The Network panel is actually nice here — you can filter by Fetch/XHR, JS, images. We had the history. We did not have that way of looking at it by site and by resource type.
Browser view
So we added a Browser view on desktop. It takes traffic we already captured and shows it by site and resource type. Sites on the left, Fetch/XHR, documents, JS, images along the top. Close to how Chrome’s Network panel works, except the data comes from the capture, so a redirect, a refresh, or closing Inspect pop-up does not wipe it.
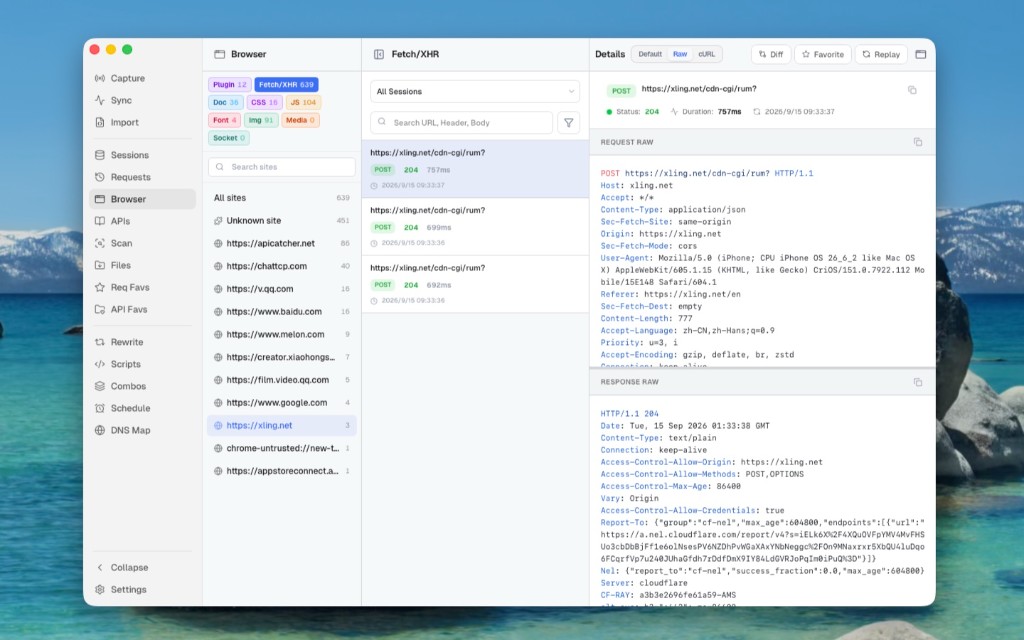
A website does not talk to one hostname. The page has its own APIs, static files often sit on a CDN subdomain, and if they dropped in Google Analytics you also get hits to googletagmanager or google-analytics. Group by the request URL’s Host and one page splits into many sites. Click one and you only see a slice.
We do not group by where the request went. We group by which page started it.
For the document request that loads the page, the site is that page URL’s own origin, e.g. https://www.example.com.
JS, CSS, images, Fetch/XHR from that page usually carry Origin or Referer. We use Origin first, Referer if Origin is missing, and attach them to that page’s site.
Google Analytics beacons and CDN subdomain assets, if the page loaded them, show up under the same site instead of each getting their own row.
Some requests have neither Origin nor Referer. We cannot tell which site they belong to, so we do not force them into one. Chrome extensions use a chrome-extension:// Origin and go under Plugin.
Browser view only shows requests from a browser. Traffic from an app does not show up here — that still lives in the request history. It is not limited to what the PC captured. Browser requests imported from a HAR, or synced in realtime from an iOS or Android device, show up in Browser view the same way.
Capture goes through the system proxy, so Chrome and apps land in the same log. To lay things out by site, we first have to pick out the browser requests.
Modern browsers send Sec-Fetch-Dest, Sec-Fetch-Mode, Sec-Fetch-Site, or Sec-CH-UA. If those headers are there, we treat it as a browser.
An Origin or Referer starting with chrome-extension:// is also a browser request, and goes under Plugin.
If none of those headers are present, we look at the User-Agent. It has to look like Mozilla plus Chrome, Firefox, Safari, or Edge.
okhttp, curl, Java, Python clients are excluded and stay out of Browser view.
Requests the Network panel cannot show, or shows for a moment and then drops, you can still see in Browser view.